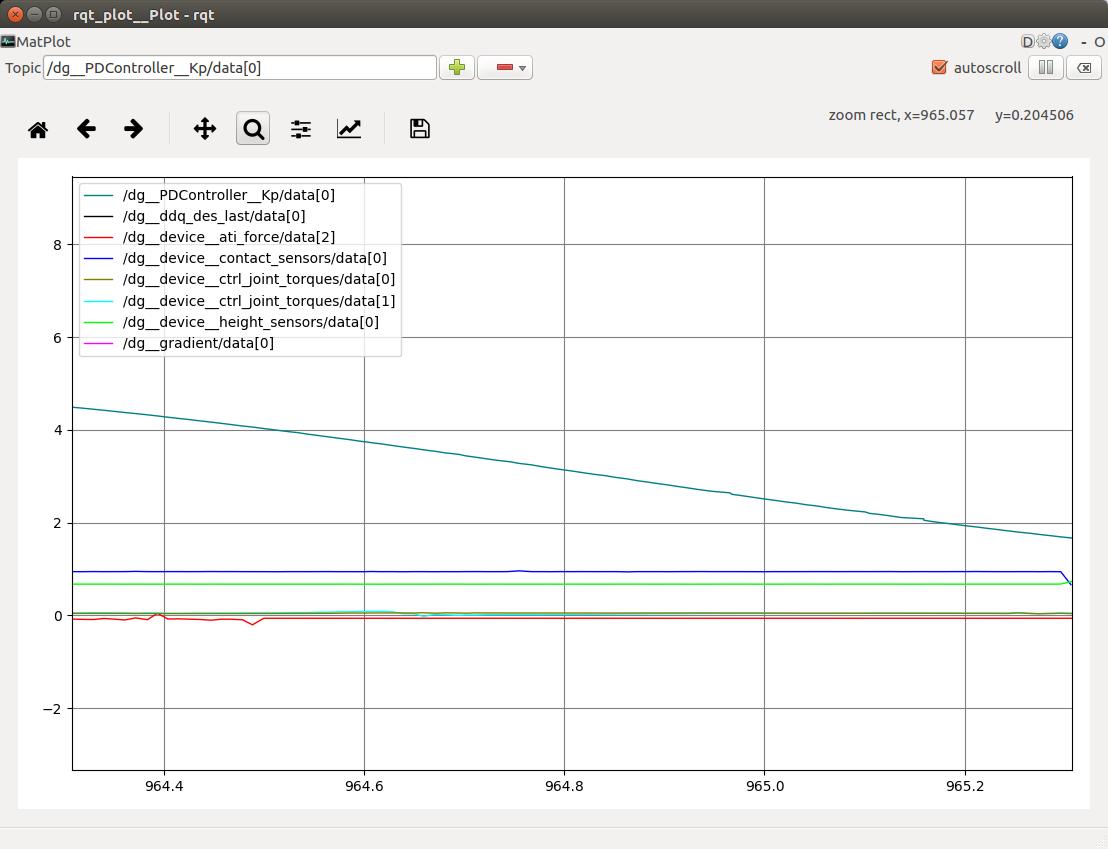
In dynamic graph manager, the sensor and control signals from and to the device are automatically exposed via rostopics.
Using rqt_plot, it is possible to get a live view of the signals' values. In addition, it is possible to log values to file (using a tracer).
5.1/ Start and stop logging a trace
You can start and stop logging the current registered tracer signals using:
The log files are stored under "~/dynamic_graph_manager/<date>_<time>/."
5.2/ Adding new signals to the tracer (for logging) and ros
By default, the input and output signals of the device are logged by the tracer and are exposed to ros. If you want to add other signals, you can do this using
Expose the entity's signal to ros and the tracer together.
5.3/ Opening dynamic graph traces in RAI
To use the RAI plotting tool (https://gitlab.tuebingen.mpg.de/SoW/amd-robot-plotting-framework), use this script (https://git-amd.tuebingen.mpg.de/amd-clmc/dg_tools/blob/master/scripts/convert_dg_to_rai.py) to convert a folder with dynamic graph dat files into a numpy compessed data file. RAI can read this compressed file.
- Todo:
- add a parser for the dynamic graph in RAI.
5.4/ How to open rqt_plot

- Make sure you have your dynamic graph manager started and the dynamic graph is running
- Open the rqt_plot by executing the following command in a terminal rosrun rqt_plot rqt_plot
- Add the values you want to plot using the input "Topic" at the top. Name the signal to plot like "/dg__device__ati_ft_sensor/" and then which vector entry you want to log "/dg__device__ati_ft_sensor/data[0]" to log the first entry from the "ati_ft_sensor" vector.
5.5/ Troubleshooting with rqt in general:
If you ever have the case where the rqt plugins loads properly but the is not responding. You should delete the lock file that are located in "~/.config/ros.org".
5.6/ Logging of motor and control process timing
The dynamic graph manager has a build in support for logging a set of timing informations. These include:
| dg_timer.dat | How long it took to run the dynamic graph process in s. |
| dg_active_timer.dat | How long the dynamic-graph process was active in s. |
| dg_sleep_timer.dat | How long the dynamic-grpah process was sleeping in s. |
| hwc_active_timer.dat | How long the motor process was active in s. That is the time without sleeping. At the point of writing this includes:
|
| hwc_sleep_timer.dat | How long the motor process was sleeping in s. The sleeping is done to ensure the motor process runs as the desired control frequency. |
| hwc_timer.dat | How long the motor process was sleeping in s. The sleeping is done to ensure the motor process runs as the desired control frequency. |
| hwc_timer.dat | The total time passed between two sleeping times of the motor process in s. |
By default these files are created in the dynamic graph manager log directory. However, the files are empty. This is as by default a length zero history is recorded. To record N timesteps, the parameter "debug_timer_history_length: 10000" (where N=10000 here, which corresponds to 10 seconds at 1 kHz) has to be specified at the top level of the robot yaml file.
